Technical Analysis of Cryptocurrency Charts: Tips for Beginners
Technical analysis of cryptocurrency charts is the practice of analyzing market movements and trends to make predictions about future price direction. It’s used by traders to identify buying and selling opportunities in the market. For beginners, learning how to read these charts can be a challenge.
Here are some tips to get started:
1. Understand basic chart patterns such as support/resistance levels, moving averages, and trend lines.
2. Familiarize yourself with popular indicators like MACD, RSI, Bollinger Bands, Stochastic oscillator etc., which help you identify potential buy or sell signals on the chart.
3. Learn more advanced strategies like Fibonacci retracements that allow you to analyze historical data for clues on where prices are headed next.
4. Monitor news events related to cryptocurrencies as they can have an impact on price action in real-time trading sessions; this will give you an edge over other traders who may not be up-to-date with current events in the crypto world!
5 .
For those getting started in cryptocurrency trading, technical analysis of charts can be a daunting task. However, with the right tools and knowledge, you can start to make informed decisions about when to buy and sell. Here are some tips for beginners who want to get started with technical analysis of cryptocurrency charts: Start by understanding the basics of charting – learn how different indicators work and what they mean; Research different strategies that have worked for others; Take time to practice on a dummy account before investing real money; Stay up-to-date on news and market sentiment surrounding cryptocurrencies so you know what could affect prices; Be sure to use stop loss orders or other risk management techniques when trading.
By following these tips, traders should be able to gain an edge in their trading.
The Only Technical Analysis Video You Will Ever Need… (Full Course: Beginner To Advanced)
How Do You Read Crypto Charts for Beginners?
Reading crypto charts for beginners can seem daunting at first, but it doesn’t have to be. You’ll want to start by familiarizing yourself with the basics of chart analysis such as support and resistance levels, trendlines, volume analysis and various indicators like Moving Averages (MA) or Relative Strength Index (RSI). Once you understand these concepts, you will be able to identify trends in the market which can help inform your trading decisions.
Additionally, using tools like TradingView or Coinigy can provide you with real-time data on different cryptocurrencies so that you always stay up-to-date on the latest news and developments. With a bit of practice and patience anyone can learn how to read crypto charts!
How to Learn Technical Analysis in Cryptocurrency?
To learn technical analysis in cryptocurrency, it is important to understand the basics of charting. This includes learning about different chart types and indicators, as well as how to interpret them. Additionally, understanding basic concepts such as support and resistance levels, trend lines, moving averages and price patterns can help traders identify entry and exit points for trades.
Finally, it is important to practice with a demo trading account until you are comfortable enough with your analysis skills before risking real money on actual trades.
What is the Best Technical Analysis Chart for Crypto?
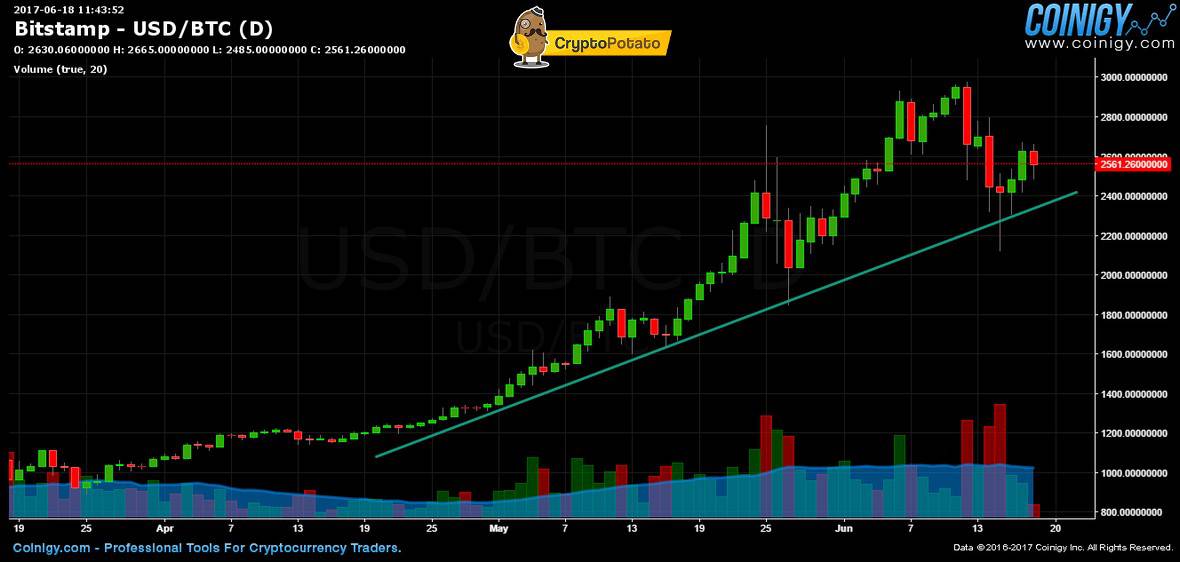
When it comes to analyzing the cryptocurrency market, technical analysis charts are one of the most valuable tools. The best chart for crypto traders is a candlestick chart, which displays price action in an easy-to-read visual format. Candlestick charts show the opening and closing prices as well as the high and low prices during a specified period of time, usually within 24 hours or less.
This type of chart can be used to identify patterns that may indicate future trends and help crypto traders make informed decisions about their investments. Additionally, many crypto trading platforms offer various customization features to enhance their user’s experience when using candlestick charts such as different indicators (such as RSI or MACD) or view settings (like zoom level).
Which Crypto Trading Strategy is Best for Beginners?
The best crypto trading strategy for beginners is to start off slow and cautiously. As with any type of investment, it’s important to do your research and understand the market before jumping in head-first. Beginners should focus on learning the basics of how cryptocurrency works, familiarizing themselves with different types of coins and tokens, understanding the various exchanges available, and developing a basic understanding of technical analysis.
Additionally, starting small can help you get comfortable with trading without risking too much capital at once. Finally, having a plan in place will help you stay focused while sticking to safe strategies like buy-and-hold or dollar cost averaging when entering into new positions.
Does Technical Analysis Really Work on Cryptocurrency?
Yes, technical analysis is a widely used strategy in the cryptocurrency market. Technical analysis is based on reviewing past price and volume data to predict future trends and opportunities. This type of analysis can be applied to any asset, including cryptocurrencies.
It involves tracking patterns in financial markets over time by looking at historical prices, trading volumes, and other indicators such as momentum oscillators or moving averages. By studying these patterns, traders attempt to identify emerging trends that could present profitable trading opportunities going forward. Although technical analysis alone cannot guarantee success in the crypto market, it does provide valuable insight into potential market movements which can help inform decisions about when to buy and sell coins for maximum profit potential.
What is the Best Chart Pattern for Crypto?
The best chart pattern for crypto varies depending on the trader’s individual strategy and goals. For those looking to buy low and sell high, an ascending triangle may be a good choice as it typically signals an upcoming bullish trend. On the other hand, those more comfortable with short-term trading might prefer a head and shoulders pattern or double bottom, both of which indicate bearish reversals.
Ultimately, there is no single “best” chart pattern for crypto; rather, traders should find the one that best suits their particular approach to trading.
Credit: cryptopotato.com
Technical Analysis for Cryptocurrency Pdf
Technical analysis is a powerful tool for predicting and managing the price of cryptocurrencies. It can be used to identify patterns in prices, determine when to buy or sell, and even anticipate future price movements. Technical Analysis for Cryptocurrency PDFs provide a comprehensive overview of how to use technical analysis techniques to analyze cryptocurrency markets.
These documents cover topics such as charting fundamentals, indicators, strategies, risk management techniques and more. With the help of these tools and resources, traders can gain an edge over other market participants by gaining deeper insights into their investments.
How to Analyze Cryptocurrency Charts
Understanding how to analyze cryptocurrency charts is essential for any investor or trader looking to make informed decisions in the digital asset market. By analyzing these charts, you can track price performance over time and identify patterns that may indicate a potential opportunity. Additionally, you can use chart analysis to detect trading signals and gain insight into market sentiment as well as view technical indicators such as support levels, resistance levels, and trend lines.
When analyzing charts, it’s important to keep an eye on both long-term trends and short-term movements so you don’t miss out on any major opportunities.
Cryptocurrency Technical Analysis Charts
Cryptocurrency technical analysis charts provide traders with valuable insight into the market and current trends. Technical analysis uses past price data to identify patterns in order to predict future prices, making it an effective tool for traders looking to make informed decisions about their investments. Technical analysis provides a way to analyze cryptocurrency performance over time, helping investors understand the underlying dynamics of pricing movements.
Furthermore, these charts can help traders anticipate potential breakouts or reversals so they can buy or sell accordingly.
Crypto Technical Analysis for Beginners
Crypto technical analysis is a method of predicting future price movements in cryptocurrency by analyzing past market data. By studying charts and indicators, traders can identify patterns that indicate where the price might go next. For beginner traders, this form of analysis provides an easy way to get started in trading cryptocurrencies without having too much knowledge or risk involved.
Additionally, understanding the basics of crypto technical analysis can help you make smarter investments and better decisions when it comes to entering and exiting trades.
How to Read Crypto Charts for Day Trading
Day trading can be a great way to make money trading cryptocurrencies, but it’s important to understand how to read crypto charts in order to maximize your profits. Crypto charts provide an easy-to-use graphical representation of the market, allowing you to quickly identify trends and patterns that may indicate buying or selling opportunities. It’s also important to use indicators such as volume and moving averages when reading these charts in order to get a better understanding of where prices are heading.
With the right tools and knowledge, day traders can use crypto charts for profitable trades.
Crypto Technical Analysis Book Pdf
Crypto Technical Analysis is a powerful tool for traders to make informed decisions when trading digital assets. A great resource for learning more about this topic is the Crypto Technical Analysis Book PDF, which provides an in-depth look at various techniques used to analyze market trends and forecast price movements. The book covers topics like charting, indicators, volume analysis and other strategies that can help traders stay ahead of the game.
It also includes practical examples on how to use these techniques, as well as useful tips on risk management. Reading up on technical analysis can give you an edge in the highly competitive world of crypto trading!
Crypto Chart Patterns Pdf
Crypto chart patterns are a great way to help traders make more informed decisions when trading cryptocurrency. With the right knowledge, you can use these patterns to predict how prices might move in the future. A Crypto Chart Patterns PDF is an invaluable resource for any trader looking to increase their understanding of crypto chart patterns and gain insight into potential price movements.
It provides detailed instructions on how to identify various types of chart formations, as well as valuable tips for leveraging them for maximum profits.
Crypto Graph Analysis App
Crypto Graph Analysis App is a powerful tool that provides users with an interactive interface to track and analyze cryptocurrency price movements in real-time. The app allows users to set up custom alerts for when prices reach certain levels or specific events occur, as well as keep up with the latest news about the crypto markets. It also features comprehensive charting capabilities, including technical analysis indicators such as MACD, RSI, Bollinger Bands and more.
With its intuitive design and easy-to-follow instructions, Crypto Graph Analysis App makes it simple for anyone interested in cryptocurrencies to stay informed and make better trading decisions.
Conclusion
In conclusion, technical analysis of cryptocurrency charts is a powerful tool for traders and investors to understand price movements and make informed decisions. While it can be intimidating at first, with the right tips and knowledge, anyone can become proficient in using these techniques to maximize their profits. With practice and dedication, you too can begin analyzing cryptocurrency charts like a pro.
